Safety View

By GM Future Roads & INRIX

Achieve Your Safety Goals with Data-driven Insights

Request A Demo


Safety View provides powerful insights about roadways to help improve safety for all road users.

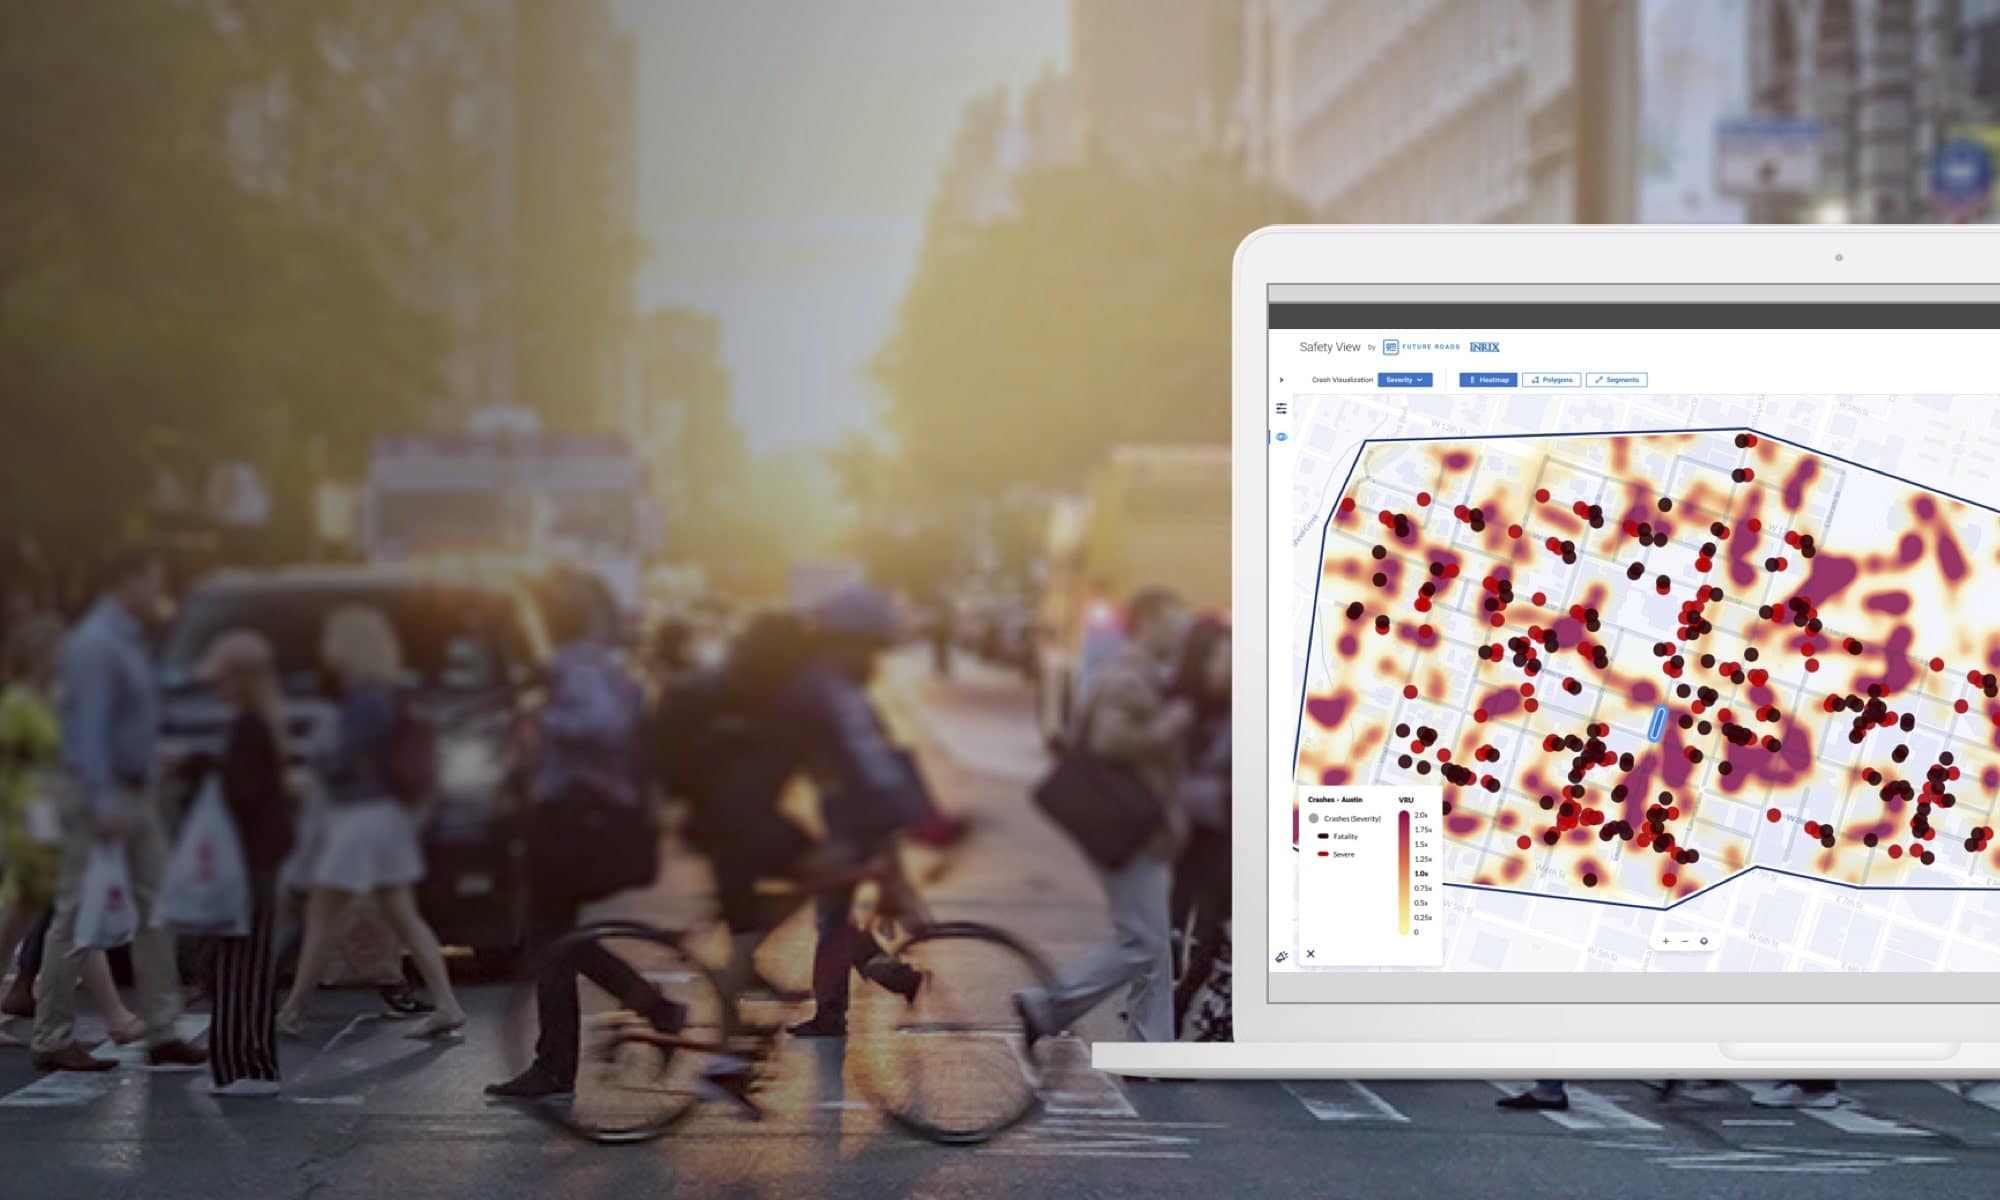
The Bipartisan Infrastructure Law provides public agencies with a once-in-a-generation opportunity to help make our roads safer for all road users and save lives.

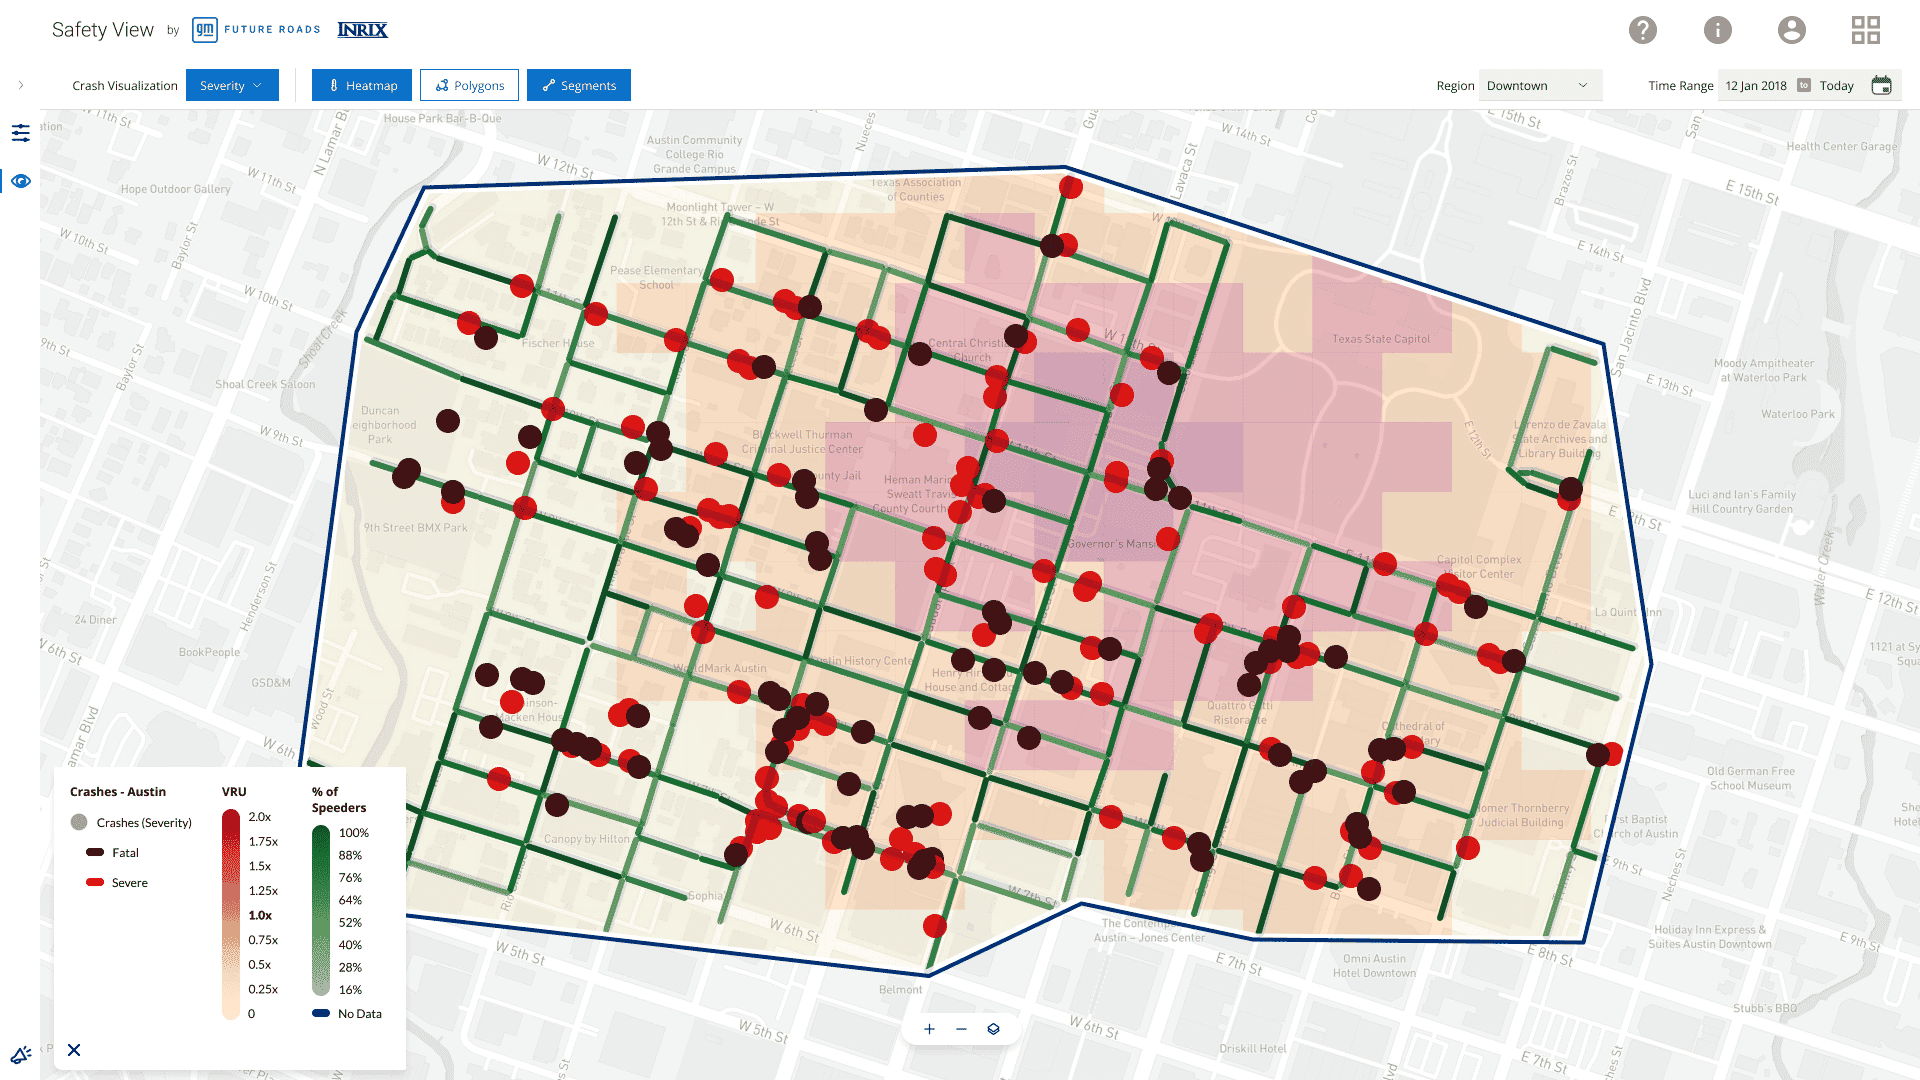
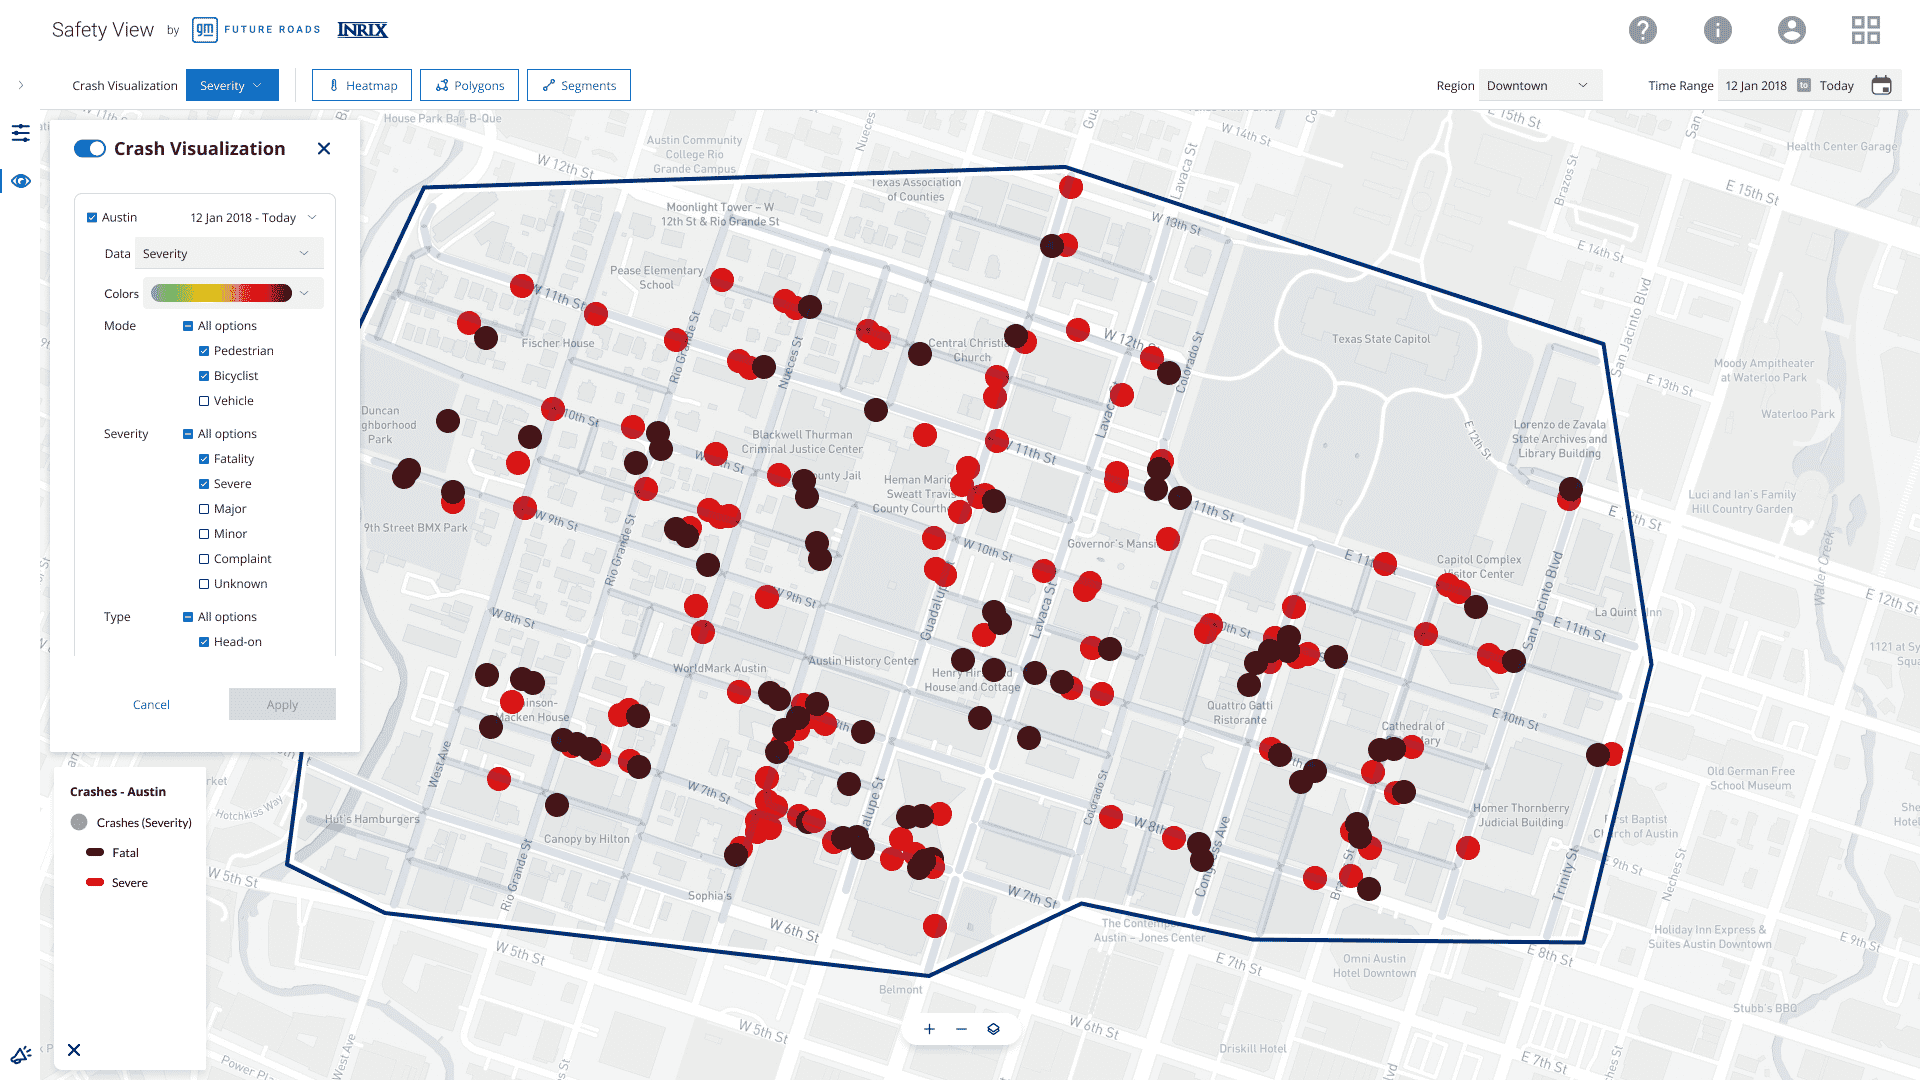
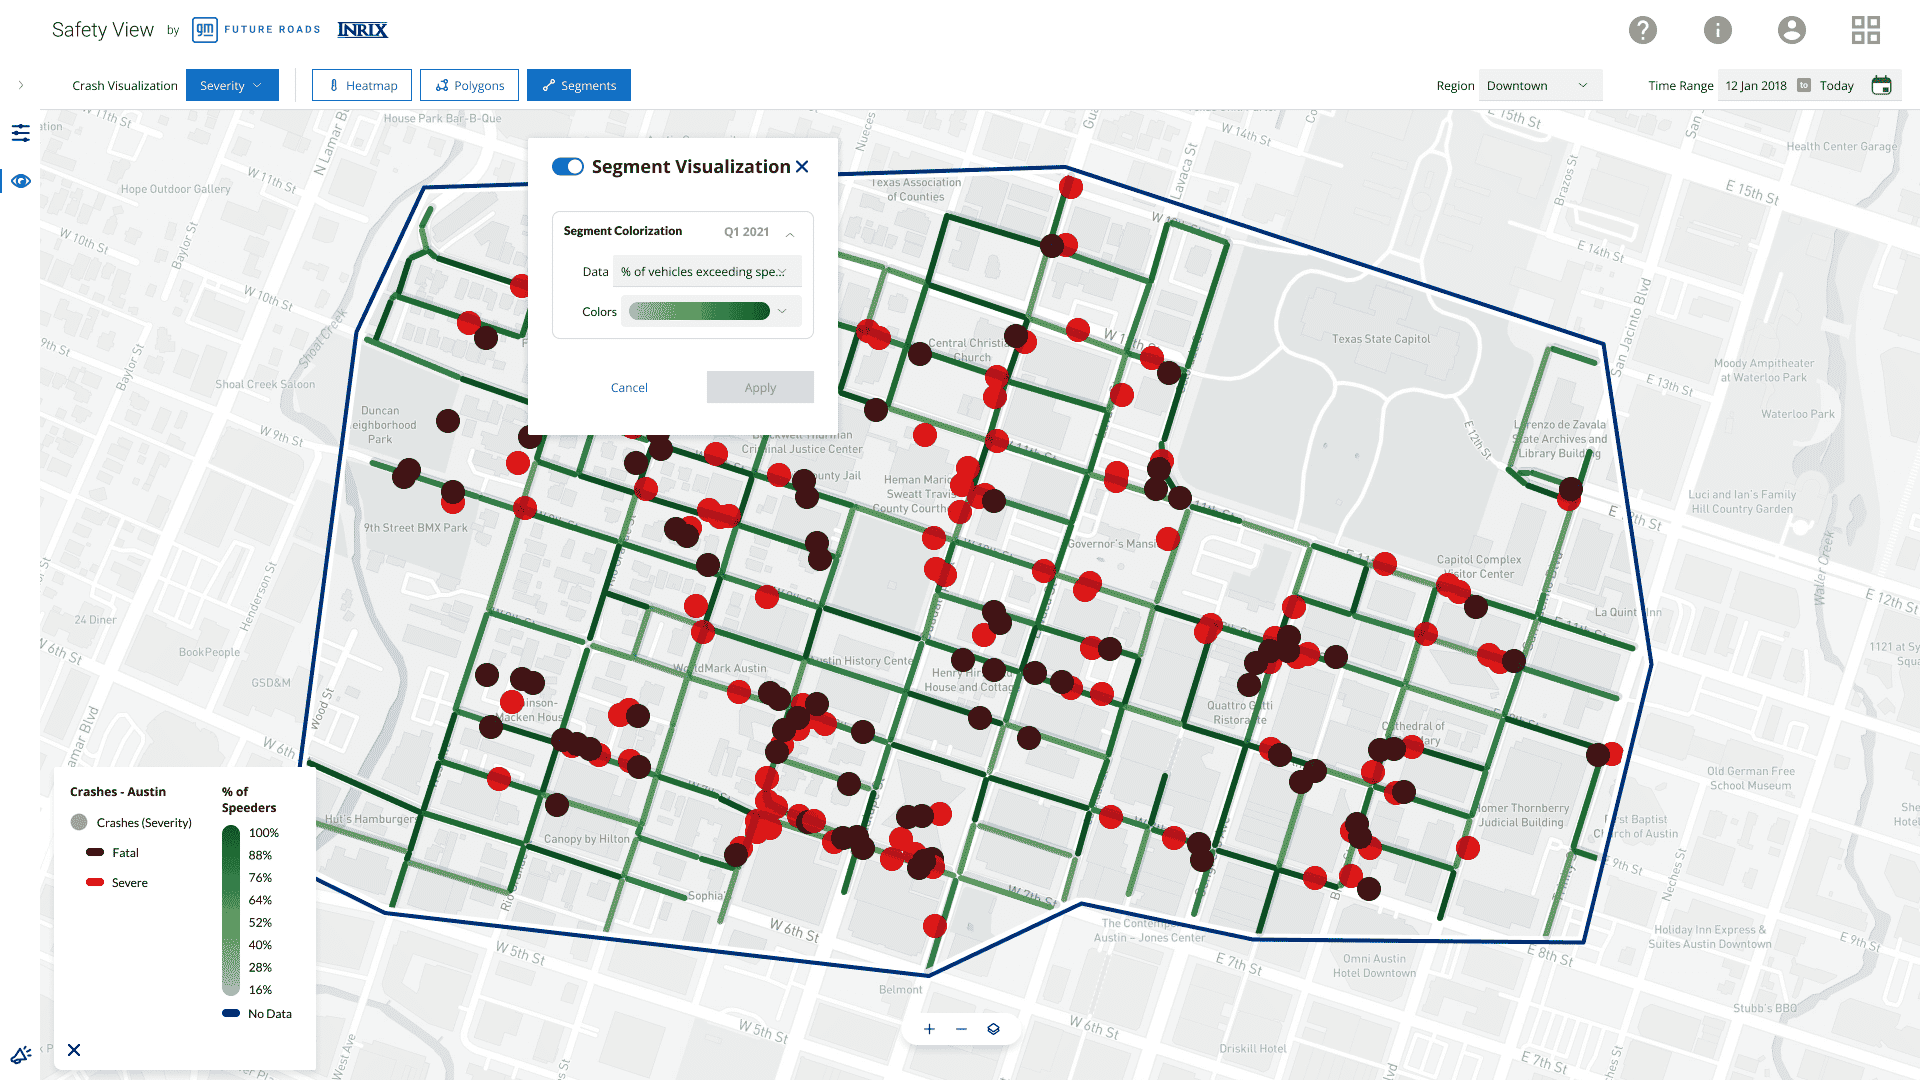
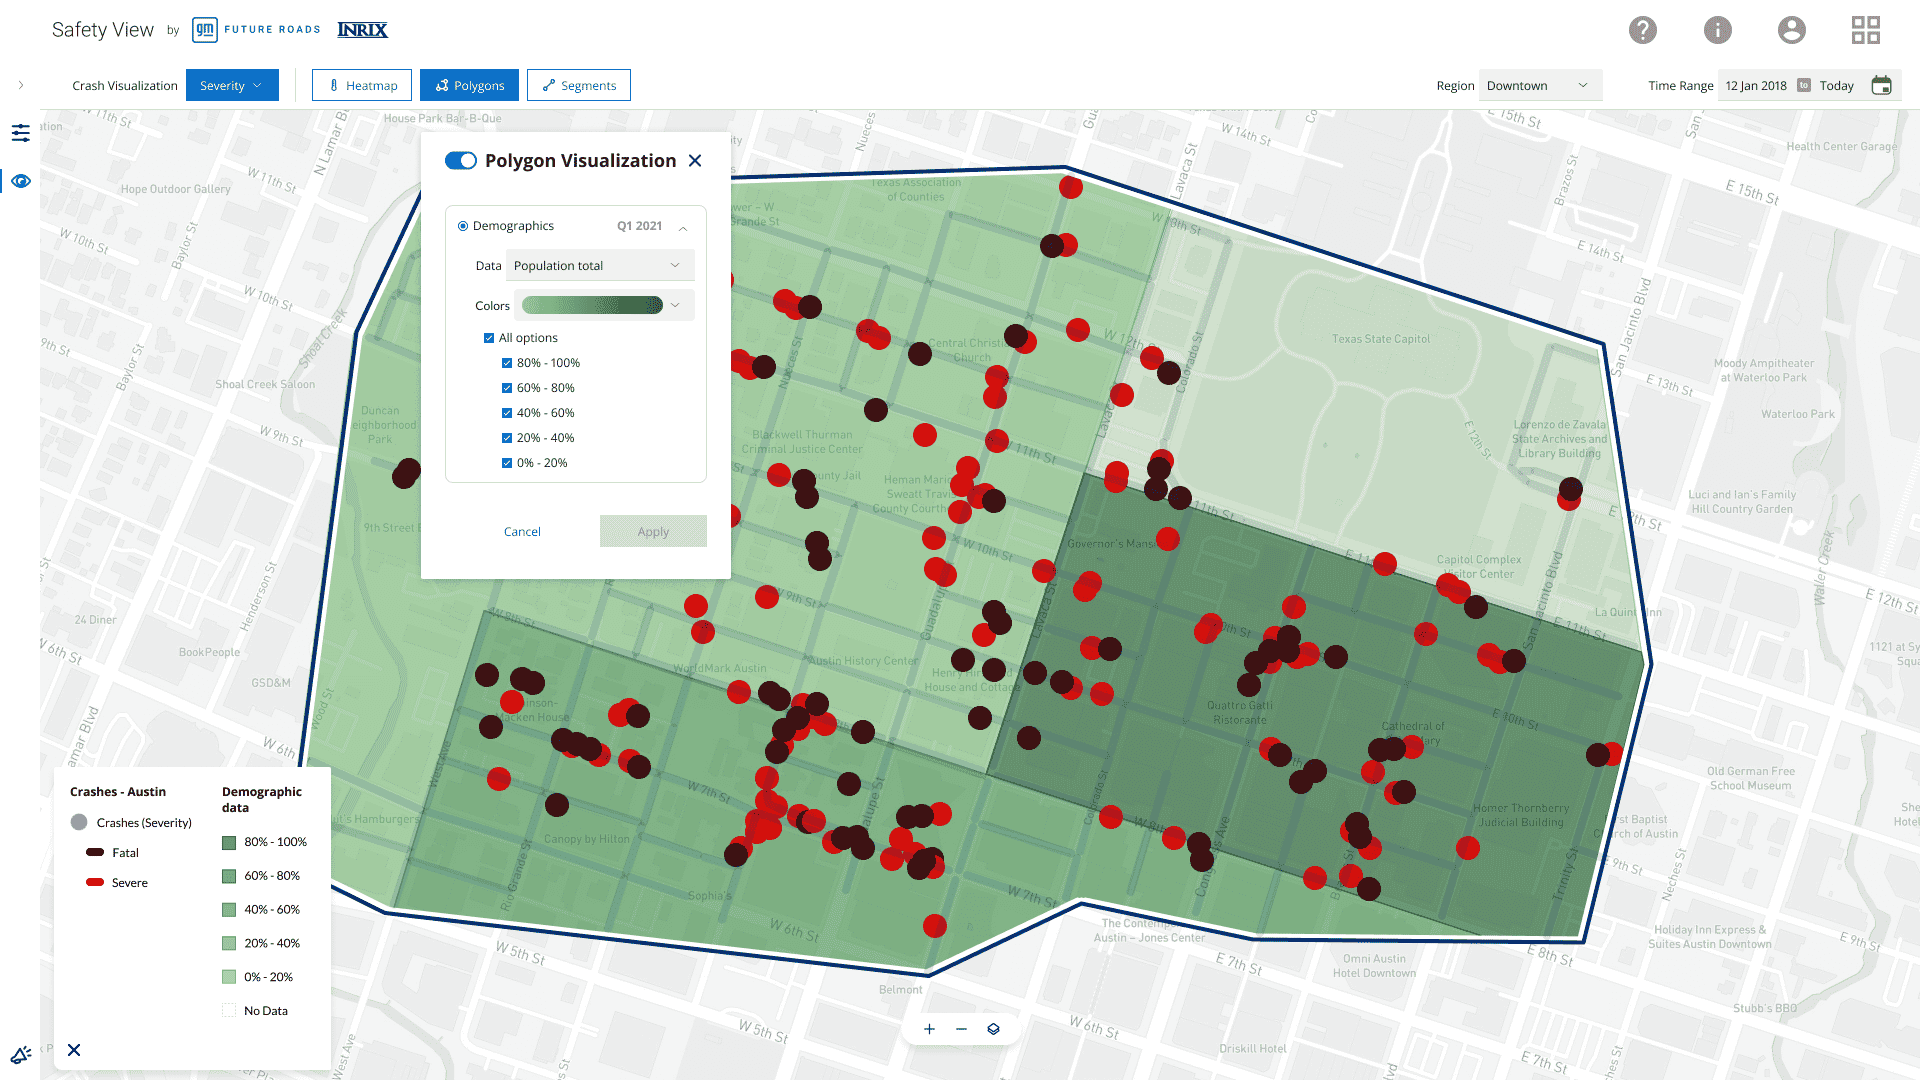
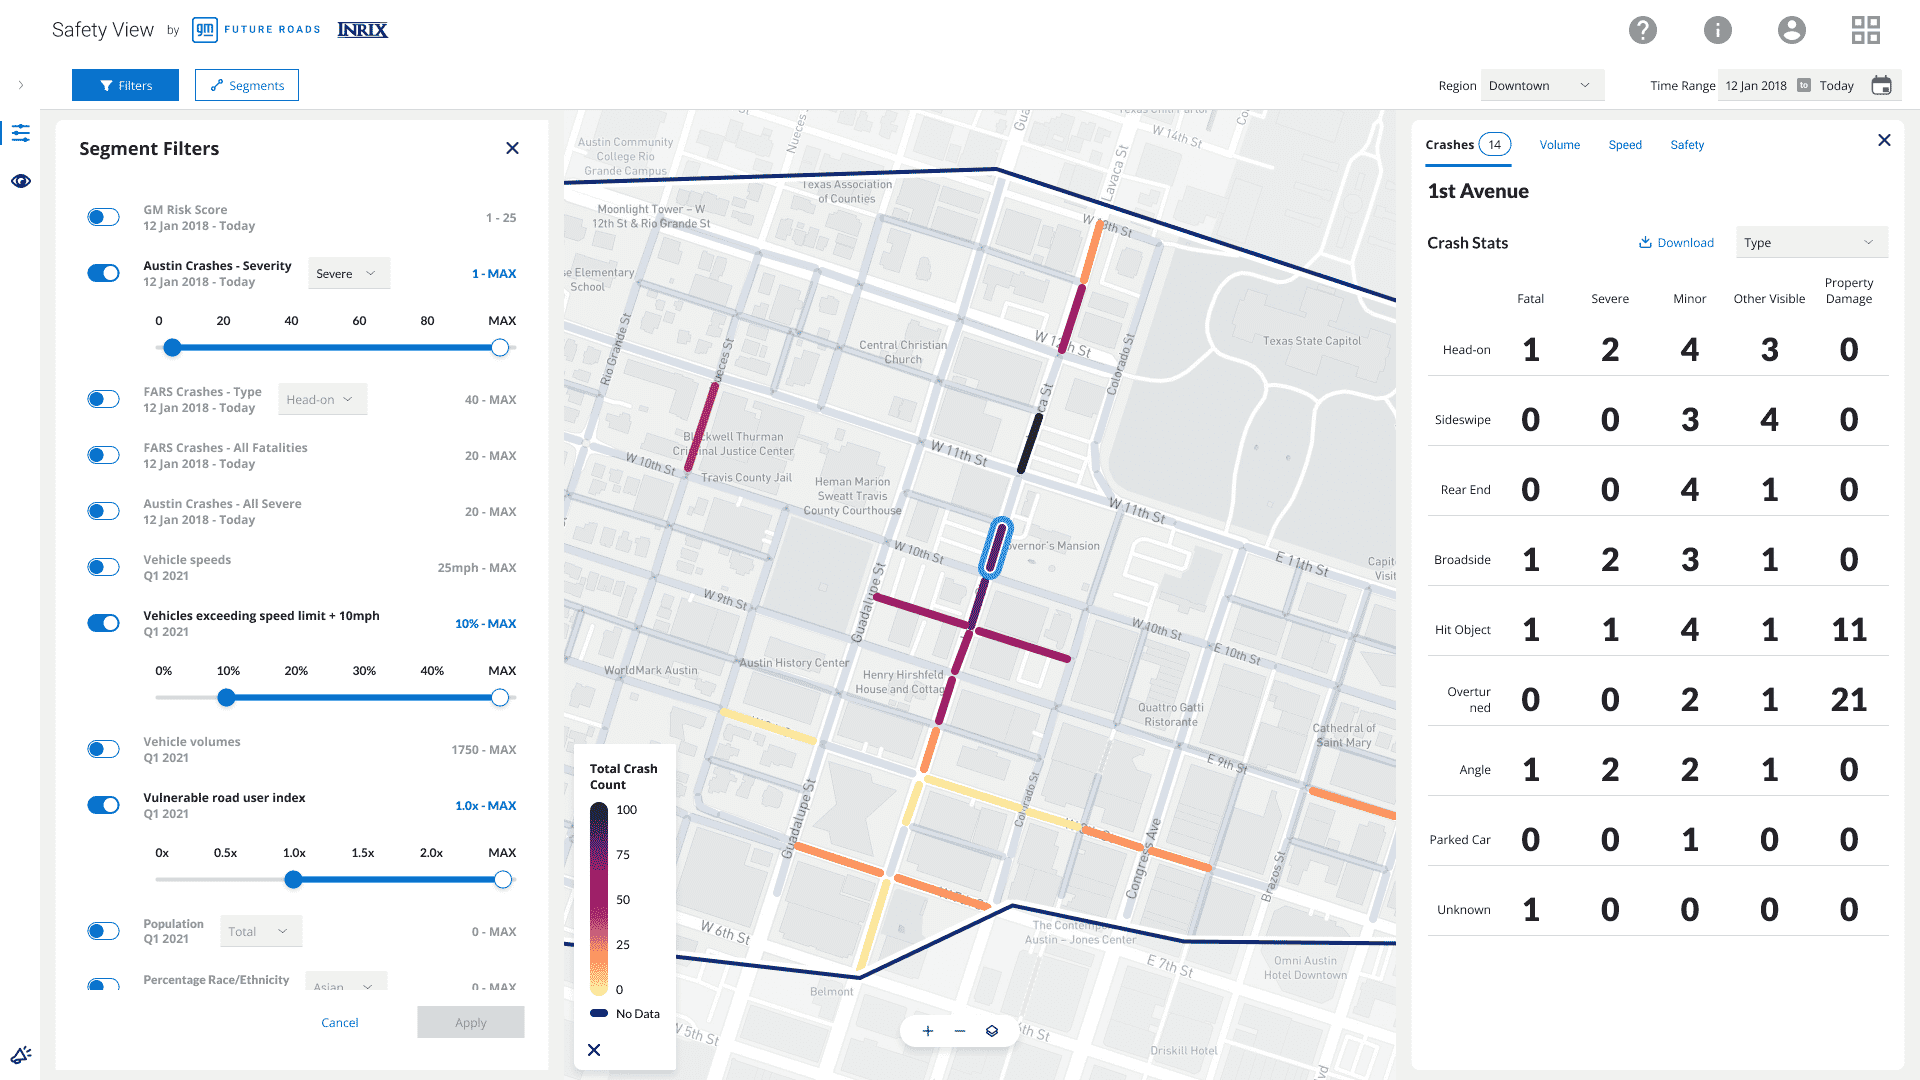
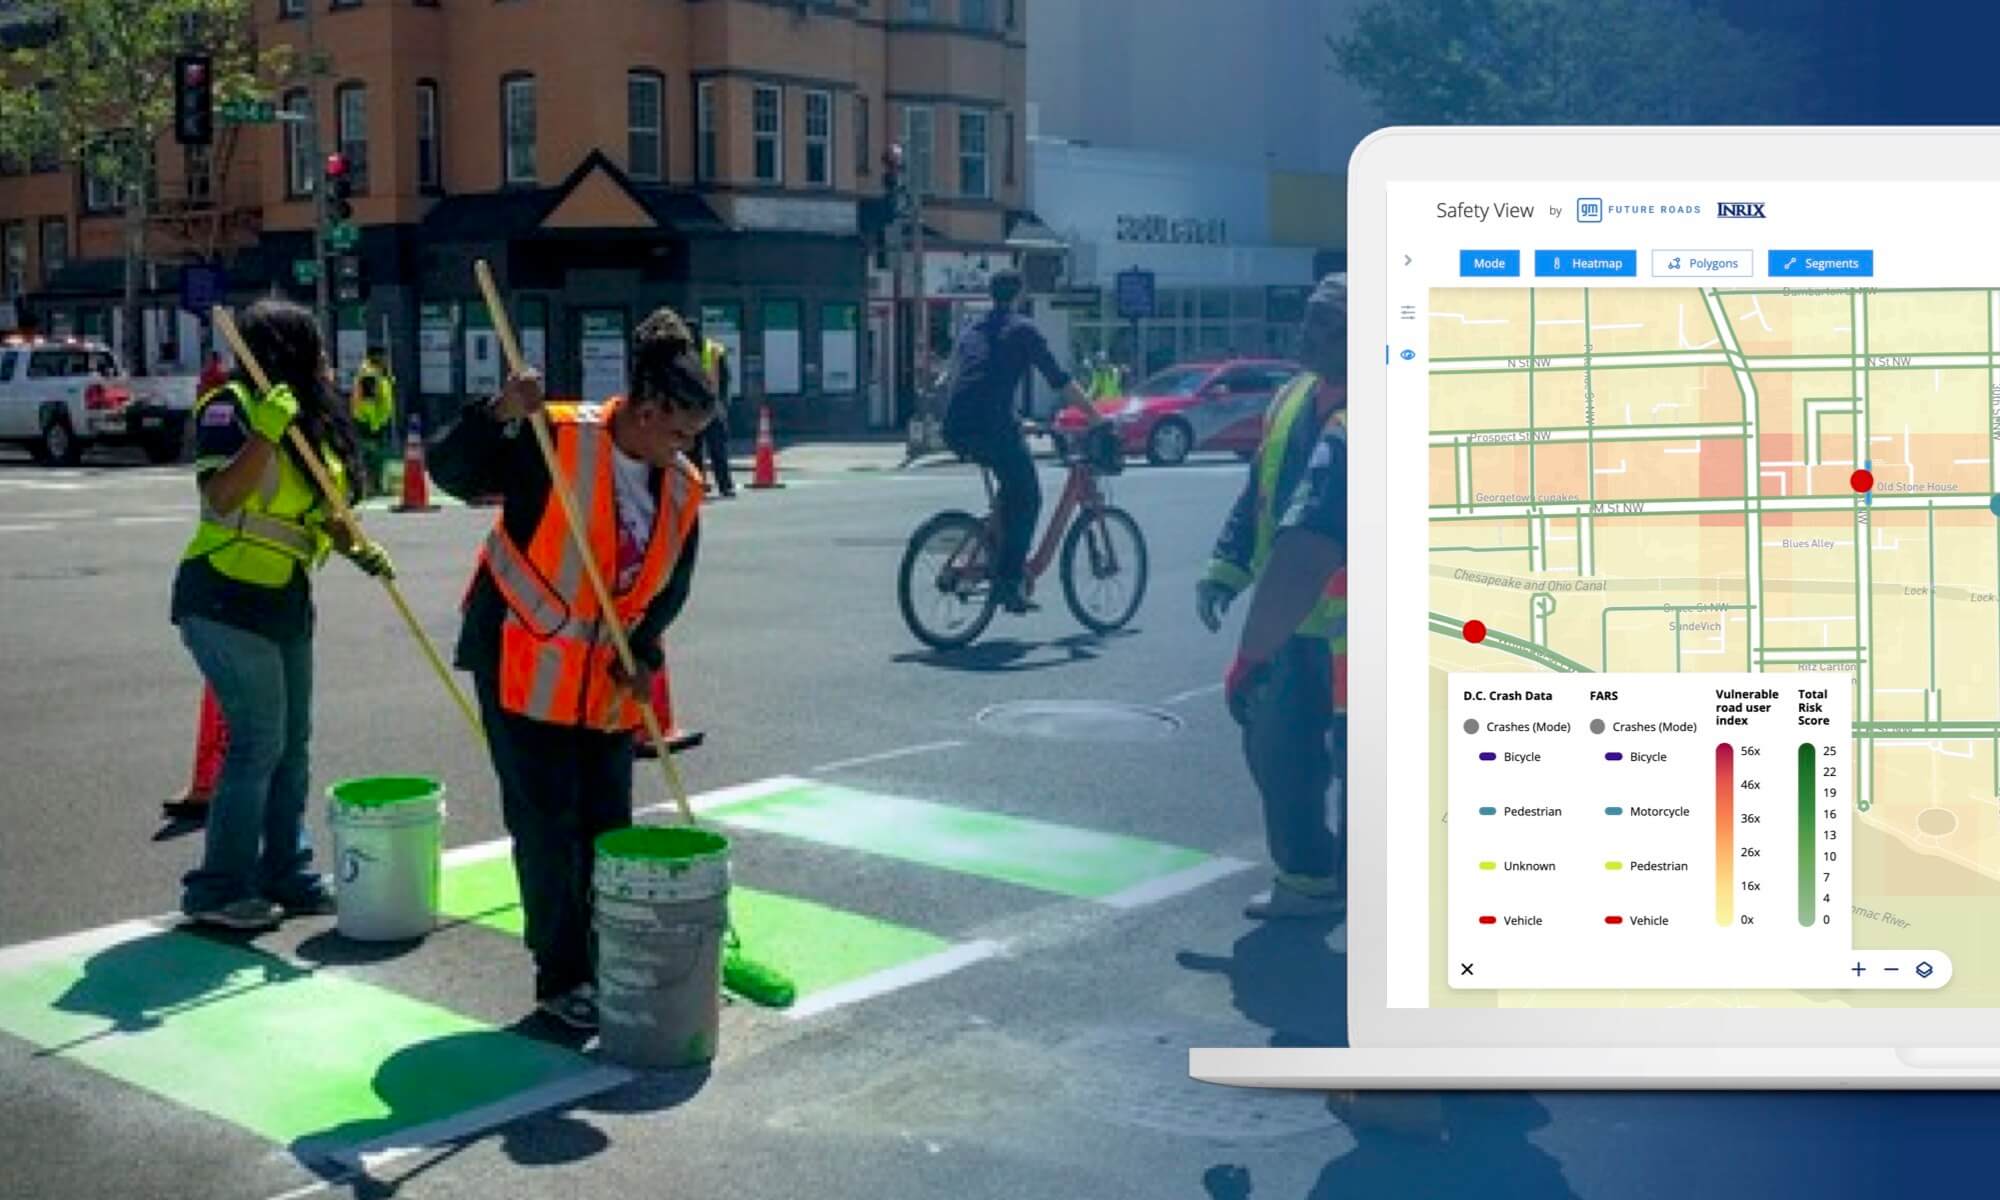
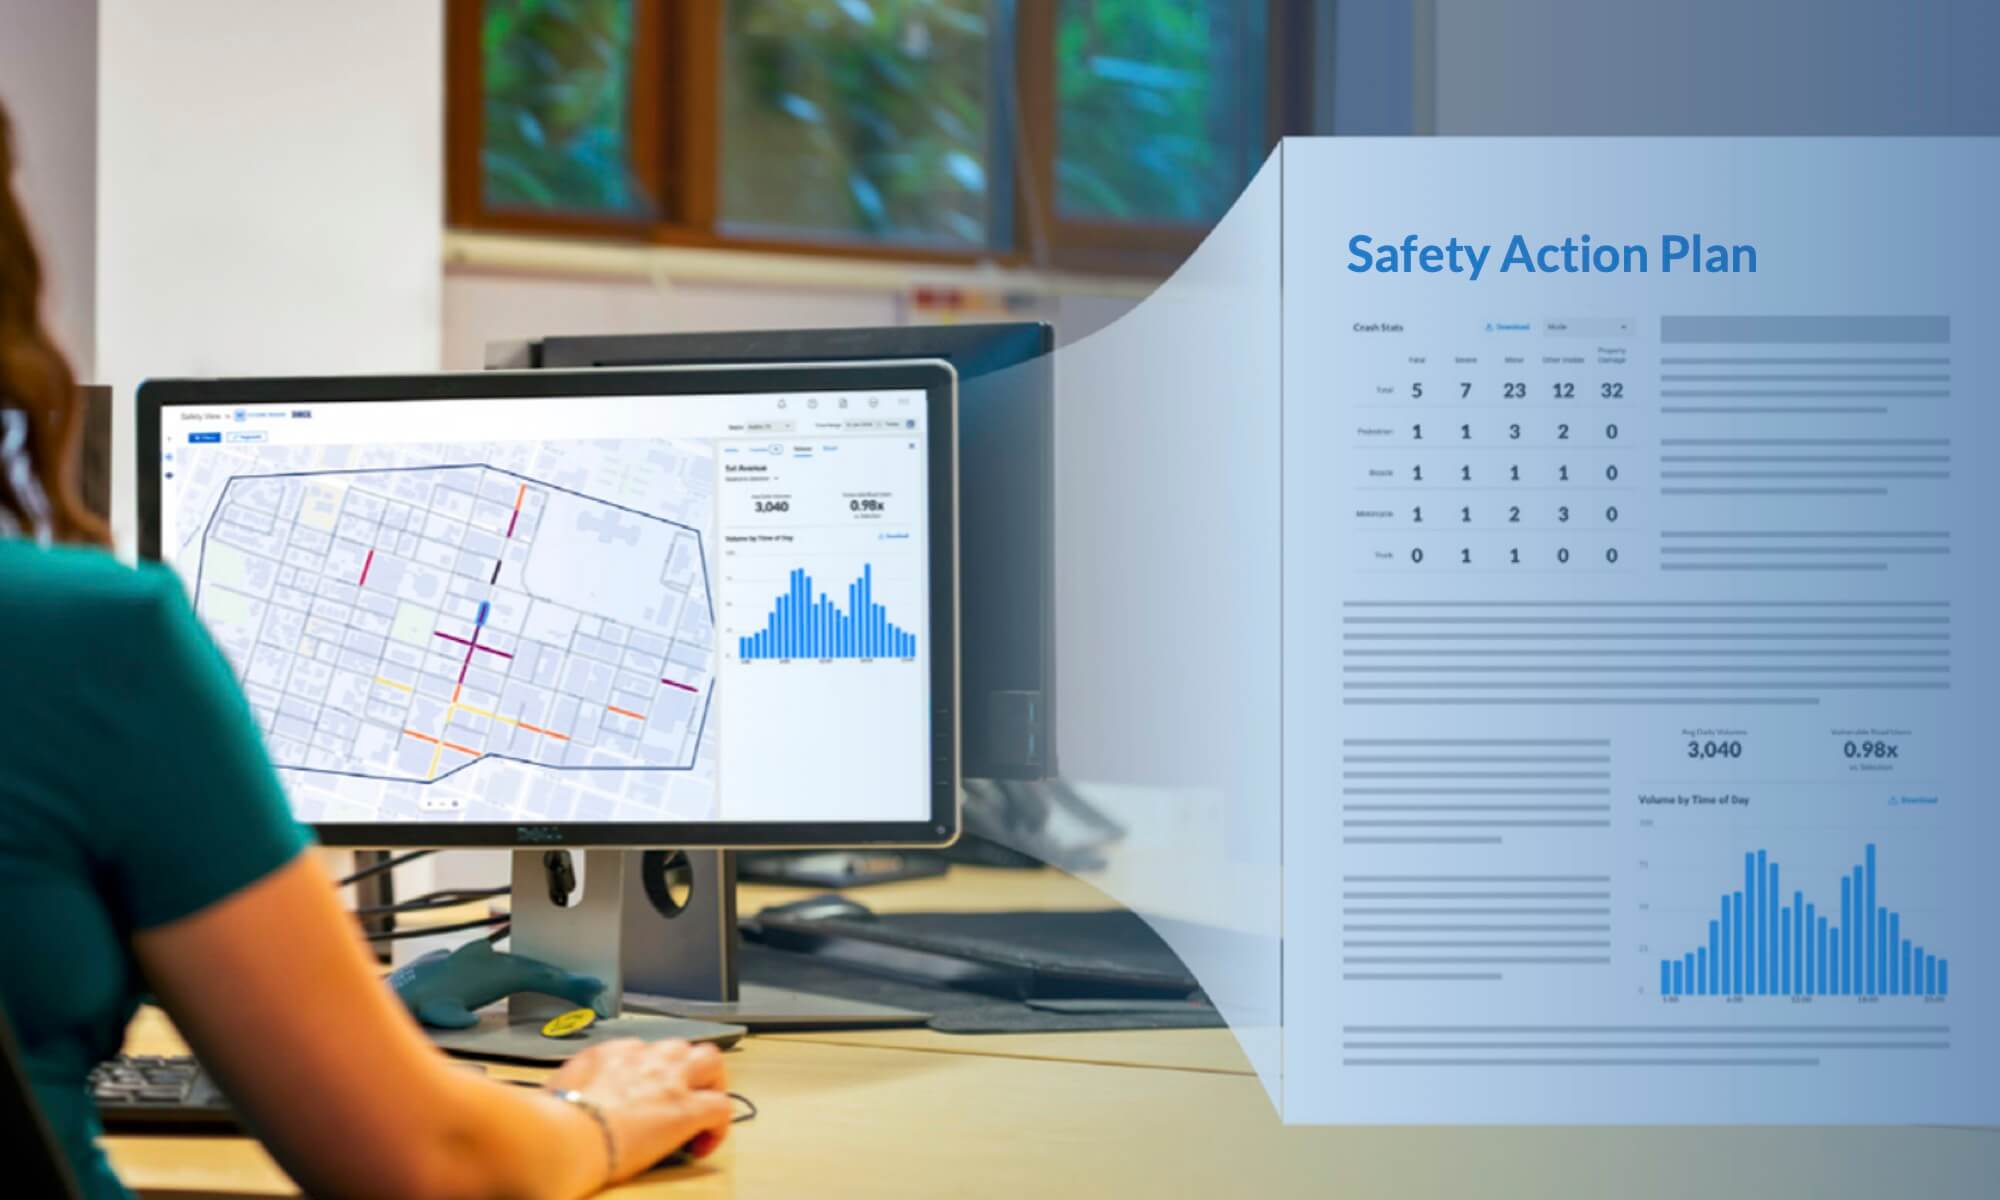
Central to public agencies’ success in improving road safety will be their ability to leverage new technologies and sources of data. Safety View is a powerful new cloud-based analytics solution developed by GM and INRIX that provides comprehensive safety data together with sophisticated analytics tools to help safety professionals across all public agencies create more informed safety plans.

Safety View is now available on INRIX IQ. Sign up for a demo to see how you can access powerful insights about roadways to improve safety for all road users.

GET STARTED

Thinking about applying for a Safe Streets and Roads for All (SS4A) grant?

Get A Complimentary Safety Analysis to Strengthen SS4A Applications

Leverage actionable insights to make data-driven decisions faster


Access critical safety and demographic datasets in one cloud-based application


Safety View is pre-loaded with the movement, safety, and demographic datasets to help view safety though the lens of equity, and lets you import your own local data.


Identify and assess risk factors for all roadway segments


Safety View provides sophisticated yet easy-to-use visual analysis tools that help you identify relative risk at the roadway segment level, gain valuable insights, and prioritize those segments that need the most attention.


Evaluate the impact of safety projects with access to near real-time insights


The speed, volumes, risk score, VRU, and demographic data in Safety View are updated regularly. Don’t wait for the next funding cycle before understanding the impacts of the safety measures you have implemented.

See how Safety View helps transportation professionals make communities safer

Safety View helps transportation professionals achieve their safety goals and better understand transportation equity by providing access to comprehensive safety data and powerful insights into the behavior of road users.

Watch Video
<


NEW RESEARCH:


INRIX School Traffic Safety Study


Download Free Report


New Research Uses Safety View to Understand School Zone Road Safety in Washington D.C

Assess Risk Across All Roadways Segments


GM Risk Score

GM Risk Score

Aggregated and de-identified connected vehicle data provide insight into the level of risk present on a particular road segment.


FARS & Agency Crash Data

FARS & Agency Crash Data

Fatalities data with crash mode, severity, type, and contributing factors help identify roadway segments that may need attention.


Speed Distribution Profile

Speed Distribution Profile

A vehicle speed breakdown by time of day for roadway segments helps you analyze how speeds may be contributing to crash rates.

Traffic Volumes


Traffic Volumes

Peak-hour traffic information helps compare crash data with congested roadway segments with link-level volume profiles.

Vulnerable Road User Index


Vulnerable Road User Index

The relative presence of vulnerable road users moving in a given area helps compare roadway segments based on VRU activity.

Demographic Data


Demographic Data

Census block group level demographic data can help practitioners start to understand the road network through an equity lens by comparing crash data with US Census information.

Intuitive Tools That Make It Easier to Create Effective Safety Plans

Holistic-View 
 

GET A HOLISTIC VIEW

View all the crash locations within your selected area. Choose to display crashes on the map by Severity, Mode, Type, or Contributing Factors.

Identify-Risky-Areas 
 

IDENTIFY RISKY AREAS

Compare crash history with local data such as vehicle volumes, speeding locations, or VRU concentration to identify locations with more fatal or severe crashes.

View Crashes Involving Vulnerable Road Users 
 

VIEW CRASHES INVOLVING VULNERABLE ROAD USERS

Use the Mode filter in Risk Analyzer to visualize crashes that only involve pedestrians and people on bikes so you can quickly understand where these users are most at risk.

Compare Crashes To Speeding Locations 
 

COMPARE CRASHES TO SPEEDING LOCATIONS

Visualize road segments where drivers are speeding and compare with crash concentration to identify overlaps.

Take Into Account Equity Considerations 
 

TAKE INTO ACCOUNT EQUITY CONSIDERATIONS

Compare demographics for various census block groups together with crash concentration or vehicle behavior to understand potential equity issues.

Analyze Details Of Individual Road Segment 
 

ANALYZE DETAILS OF INDIVIDUAL ROAD SEGMENTS

Use any of the data types as a filter to identify risky roadway segments and visualize crash count, volume, speed, and safety details for that segment.

Features

  • Easy-To-Use

    This intuitive, cloud-based service for road safety analysis allows you to perform detailed analysis without ever leaving your desk.

  • Immediately Available Insights

    After signing up online, we flip a switch to instantly turn on your subscribed area so you can start exploring the data instantly.

  • Bring Your Own Data

    We will help you bring your own local crash data on top of provided FARS crash data, so you get the complete picture in just one screen.

  • Risk Analyzer

    The Risk Analyzer module allows you identify roadway segments that match specific risk criteria by using a variety of filters associated with pre-loaded and imported datasets.

  • Data Explorer

    Visualize all pre-loaded and imported datasets on the map for every roadway segment in your geography, including speed, volume, and risk score.

  • Time Ranges

    Query a specific area for different time periods so you can easily view the impact of the safety measure you have implemented for different time periods.

Featured Content

Request a Demo

See How You Can Put Safety View to Work Today